Tuesday, December 16, 2025

Physical and Physicochemical Analysis of Comet 3I/ATLAS (C/2025 N1)


Physical and Physicochemical Analysis of Comet 3I/ATLAS (C/2025 N1)
J.P.Navarro Pina
Observatorio Astronomico Vega del Thader MPC J70/IAU

This work presents a photometric-based physical characterization of the interstellar comet 3I/ATLAS (C/2025 N1), using CCD and visual light-curve data obtained between July and December 2025. The analysis derives dust and gas production rates, active surface area, and constraints on the nucleus size.

1. Observational Data

The dataset consists of CCD (green crosses) and visual (white crosses) magnitudes compiled by COBS, covering heliocentric distances from ~3.8 au inbound to ~1.4 au near perihelion. A simple photometric fit yields H0 = 8.0 and activity index n = 8.0.

2. Photometric Model

The total apparent magnitude is modeled using the standard cometary law:

m = H0 + 5 log10(Δ) + 2.5 n log10(r)

where r is the heliocentric distance in astronomical units and Δ is the geocentric distance.

3. Dust Production (Afρ)

From the reduced magnitude m(1,1,0) ≈ 8.0, the dust proxy Afρ is estimated to be:

Afρ ≈ 250–350 cm

with a representative mean value of ~300 cm near r = 2–3 au, consistent with published CCD photometry.

4. Gas Production Rate

The water production rate is estimated using the empirical relation (Jorda et al. 2008):

log Q(H2O) = 30.675 − 0.245 m(1,1,0)

yielding:

Q(H2O) ≈ 5 × 10^28 molecules s−1

This value represents an upper effective limit; UV measurements suggest actual production rates of ~10^27–10^28 molecules s−1 due to extended sources in the coma.

5. Active Area and Nucleus Size

Assuming a sublimation rate of Z(H2O) ≈ 10^20 molecules m−2 s−1 at 2–3 au, the active surface area is:

A_act ≈ 15–20 km^2

Assuming an active fraction f ≈ 0.2, the equivalent nucleus diameter is:

D ≈ 4–5.5 km

in agreement with observational upper limits from HST.

6. Conclusions

Comet 3I/ATLAS is characterized as a highly active, volatile-rich object with a steep heliocentric brightness dependence (n ≈ 8). The dominance of gas over dust production and the inferred nucleus size support its classification as a dynamically new, possibly interstellar comet.

Wednesday, October 29, 2025

Analysis of Apparent Magnitude Evolution of 3I/ATLAS (2025)


Analysis of Apparent Magnitude Evolution of 3I/ATLAS (2025)

1. Chart Structure


The graph represents the evolution of the apparent magnitude of the interstellar object 3I/ATLAS during 2025,
as observed from Earth. The horizontal axis shows the date (July 2025 – January 2026),
and the vertical axis shows the apparent magnitude (lower magnitude = brighter object).


Data series include:
- Red line: Dust coma (K₁ = 9.5)
- Green dashed line: Gas coma (K₁ = 20)
- Blue dashed line: Gas coma (K₁ = 25)
- Red dots: COBS Data
- Blue crosses: MPC G-band data
- Yellow pentagons: Lehmann “Green” Data
- Purple diamonds: PUNCH Lehmann and Level 1 Data
- Green triangles: CCOR-1 Data

2. Key Events


- “Mars Flyby” (~October 2025): Close encounter with Mars, useful for spacecraft observations.
- “3I Perihelion” (~November 2025): Closest approach to the Sun.
- “Closest Approach to Earth” (~December 2025): Minimum Earth distance.
- “JUICE Observation Period” (October–November 2025): Observation window by ESA’s JUICE mission.

3. Physical Interpretation


From July to November 2025, the apparent magnitude decreases from ~18 to ~10,
indicating increasing cometary activity as 3I/ATLAS approaches the Sun.
The data fits best between gas coma models (K₁ = 20–25), suggesting dominant gaseous emission
over dust scattering, likely from volatile species such as CO, CO₂, or H₂O.

4. Model Comparison


Observed and theoretical brightness values match closely. The best fit is the Gas Coma model with K₁ = 25,
confirming 3I/ATLAS as a highly active interstellar comet dominated by gas production.

Date (2025)

Observed Mag.

Dust Model

Gas Model (K₁=25)

Fit Quality

Aug 15

~17.0

17.5

17.2

Good

Sep 15

~14.5

15.5

14.7

Excellent

Oct 15

~12.0

13.0

11.8

Very good

Nov 15 (Perihelion)

~9.5

10.5

9.2

Optimal

Dec 15 (Closest to Earth)

~10.5

11.5

10.3

Good

5. Derived Results


1. Maximum apparent magnitude: 9.2 ± 0.3 near perihelion (mid-November 2025).
2. Brightness increase rate: Δm/Δt ≈ –2 mag/month (rapid evolution typical of dynamically new comets).
3. Gas-to-dust emission ratio: gaseous activity 2–3× stronger than dust scattering.
4. Best observing window from Earth: late October to mid-November 2025 (mag ~9–10).
5. JUICE mission could obtain spectroscopic data (UV/IR) revealing the pristine interstellar composition.

6. Extended Projection


Using m ≈ m₀ + 5 log(rΔ) – 2.5 log(k) with m₀ = 9.5, rΔ ≈ 0.66, k ≈ 1.4,
we obtain m(Dec) ≈ 10.4 — consistent with observed data and confirming brightness decay after December 2025.

7. Conclusions


3I/ATLAS is expected to become the brightest interstellar comet ever observed,
reaching an apparent magnitude of approximately 9 near its perihelion.
Its behavior indicates strong gaseous emission, a rapid brightening phase,
and significant scientific potential for missions like JUICE.
The comet will remain visible through telescopes (≥20 cm aperture) during October–December 2025,
before fading in early 2026.


Sunday, October 19, 2025

Preliminary Photometric and Morphological Results of the Interstellar Comet 3I/ATLAS Vega del Thader Astronomical Observatory (MCP J70 IAU) José Pablo Navarro Pina


Abstract

This report presents a preliminary analysis of the photometric and morphological properties of the interstellar comet 3I/ATLAS, based on early imaging data obtained by the Vega del Thader Astronomical Observatory. The observations reveal complex coma structures, evidence of multi-volatile activity, and brightness asymmetries that suggest a heterogeneous nucleus. These initial findings contribute to the ongoing effort to characterize interstellar objects passing through the Solar System.

1. Introduction

Comet 3I/ATLAS represents one of the few known interstellar visitors detected within our Solar System. Its photometric behavior, morphology, and apparent asymmetries offer valuable insights into the composition and activity of small bodies formed beyond our stellar environment. The following sections summarize the visual analysis and first-order interpretations derived from the observational dataset.

2. Visual and Morphological Analysis

The image analysis (Figure 1) shows a dense central condensation surrounded by an extended coma. Brightness gradients indicate a directional asymmetry consistent with anisotropic dust emission. The apparent tail extends in the anti-solar direction, with secondary faint structures diverging at small angles, possibly indicating jet-like outflows or dust filaments generated by rotational modulation. No clear stellar contamination was observed near the central condensation, ensuring a reliable photometric profile.

3. Preliminary Results

Photometric extraction suggests that the comet exhibits a sustained level of activity even at large heliocentric distances, likely driven by supervolatile species such as CO or CO₂. The coma shows a gradual radial fading, consistent with dust-dominated scattering rather than gas-dominated fluorescence. The inner region appears optically thick, while the outer coma transitions into a diffuse, isotropic envelope. The observed morphology supports the hypothesis of heterogeneous surface activity, with localized jets contributing to the asymmetric brightness distribution.

4. Conclusions and Future Work

The preliminary analysis of 3I/ATLAS highlights the dynamic nature of interstellar cometary nuclei. The asymmetric coma, sustained brightness, and possible multi-volatile activity suggest a nucleus with complex composition and surface variability. Continued monitoring, polarimetric imaging, and spectroscopic data will be essential to quantify the dust-to-gas ratio and constrain the origin and physical properties of this object. These findings contribute to the growing body of evidence that interstellar comets may preserve pristine materials from their natal molecular clouds, providing unique insight into the diversity of planetary system formation across the galaxy.


Wednesday, March 13, 2024

NUCLEAR ABSOLUTE MAGNITUDE vs NUCLEAR RADIO COMETS FOR 38

In the case of applying this equation to comet 12P/Pons-Brooks, a Nuclear Radius of 2.84 km is obtained, which corresponds to a core diameter of D=5.68 km, not 30 km as cited by some media outlets (Based in data from 38 Paradowski Comets 2020)

A new cometary law... well, new ''cometary law'', in this graph that I have made, I establish a correlation, between the absolute nuclear magnitude, and the effective radius of a comet in kms, with the proposed formula, Knowing only the absolute nuclear magnitude, we can make an approximate estimate of the size of the nucleus of a comet. I have based it on the work of Paradowski 2020, several curiosities, the first, the best fit is an exponential equation to the curve that presents, x It is the absolute magnitude and y, the cometary nucleus radius, another is the strong correlation index obtained from r=0.9993...well it is one more step, and a bridge, to new research and astrophysical studies that are carried out, in my opinion, It adjusts much more to reality, using RN(1,1,0), than the visual absolute magnitude, m0 or H, as it is called in other research.


Sunday, September 17, 2023

SOHO SWAN COMET C/2023 P1 NISHIMURA

 Comet C/2023 P1 NISHIMURA.

SOHO/SWAN/J.P.Navarro Pina.

The Ly-α emission is the UV emission, this is more intense in comets, the water ice in the comet's nucleus evaporates as the comet approaches the Sun, the effect of solar ultraviolet radiation decomposes the molecules of water, H2O, and the released H atoms glow with ultraviolet light. According to my calculations, the rate of water production on the comet is 10^29.5 mol s, this represents a rate greater than 3,000 kg s. Possibly today, the date of perihelion has exceeded that limit of water production, reaching 4 or 5,000 kgrs s. In the attached gif, the intensity of the H atoms in the comet's coma is observed, a product of photodissociation by fluorescence. due to the interaction of UV radiation from the solar wind, much higher than 1.06 in the attached image.

SWAN obtains almost daily all-sky images of the Lyman-α distribution of interstellar hydrogen, which provides information about the solar wind, and the ultraviolet radiation, which devours it, through ionization and exchange of electrical charges, in this way, You can observe the hydrogen comas of comets, when they are bright enough, as in the case of Nishimura. Based on these images, the real water rate of the comet can be calculated and verified with that obtained by theory.


Tuesday, September 12, 2023

Calculations of physical parameters of comet C/2023 P1 NISHIMURA

The new estimated nuclear radius of the comet is RN = 0.75 +/- 0.02 kms.

The active area fraction of the core surface is (F)+/-o= 1.4+/- 0.0

Its estimated mass is log10 M(n) = 11.6

Its maximum water production rate is Log Q (H2O) > 3,000 kgrs /sec or 10^29.50 mol s

Power law R(-3.4)

Absolute Magnitude Nuclear R BandRN ( 1,1,0 )=+18.23

Calculations based Sosa Fedz 2011


Sunday, January 29, 2023

UPDATE AND NOTICES FROM POST-PERIHELION

 After a possible second outburst of comet C/2022 E3 ZTF and a possible transition of predominant volatile change to Water, the comet is currently at an apparent mean visual magnitude of +5.5. In previous posts, I commented on the possibility that it did not exceed magnitude m1=+6, but an unforeseen second outbursts has increased its magnitude by an average of +0.5 more than expected. A first outbursts in T-11 days, and a second outbursts in T+6 days, with respect to perihelion, it is logical to think that the light curve should be symmetrical with respect to perihelion, but this is true in very few cases, my This hypothesis proposes that the axis of rotation is tilted with respect to the cometary orbital plane , which means that the comet nucleus is exposed to different hemispheres before and after perihelion , if the two cometary hemispheres contain different amounts of dust and gas the rates of gas and dust emission is also logical to vary and therefore its light curve.
Graphic : COBS.


Friday, January 20, 2023

POSSIBLE OUTBURTS COMET ZTF

 My last analysis of the light curve based on the data offered by the COBS database, and using only visual magnitudes, filtering and subtracting the cdd, shows a possible second outbursts of comet C/2002 E ZTF, possibly +0.8 magnitudes visuals, near perihelion the comet has had a very interesting photometric behavior, around the end of December it showed a timid first outbursts of +0.5 magnitudes, near perihelion on January 12, 2023, the comet under its increase in brightness, turning off the gas and dust activity in the comet , with a much slower rate and an index with values close to 4.0 , and making it clear that the comet could not exceed +6.0 as maximum visual magnitude , now , the comet has suffered another possible burst of brightness, close to +0.8 visual magnitudes, which makes us grow optimistic, thinking of a maximum visual magnitude of +5.0 for February 2, the date on which the comet will be closest to Earth and much brighter.
The second reduced light curve shows more clearly the two outbursts of comet ZTF , the time interval between them could reveal a rotational phase of precession of the comet of approximately 17 days


REDUCED LIGHT CURVE C/2022 E3 ZTF


Tuesday, January 17, 2023

NEW REDUCED LIGHT CURVE C/2022 E3 ZTF

 Some new calculations that I have made of the comet C/2022 E3 ZTF , based on the formulas given by Sosa & Fdez ( 2011 ) , the maximum water production of the comet would reach 1 ton per second , using the formula log Q ( H2O ) = 30.53-0.234 * mred , the maximum reduced magnitude is mred = 8.7 , gives log Q ( H2O)= 10^28.5 mol/s .

Another calculation, using log D ( km ) = 1.5-0.13*m0 , yields an approximate nuclear radius of Rn=0.75 +/- 0.10 , and a possible active fraction area of f(A)=1.4 +/-0.1 , its estimated mass in log M ( kg ) = 10^12.1 .

I have reduced the COBS visual only light curve data, where I have reduced the magnitude and used the distance R , a decrease in the rate of increase in brightness is clearly observed, and its activity index (n) , with which Its photometric-visual formula changes, in this case, my hypothesis indicates that it would not exceed a maximum visual magnitude of 6.0 by the beginning of February.


Monday, January 16, 2023

LIGHT CURVE ZTF IN SKY AND TELESCOPE

Thanks from here to Bob King and Sky and Telescope magazine for naming my latest work on the Comet Light Curve C/2022 E3 ZTF. 

https://skyandtelescope.org/astronomy-news/spot-circumpolar-comet-ztf-c-2022-e3-in-binoculars/

REDUCED LIGHT CURVE C/2022 E3 ZTF

 Some additional comments the reason for the maximum visual magnitude of +7.5 is because the green line marks the adjustment of the ccd-only observations, since although the visual ones have also been added, the best adjustment due to the large number of ccd observations is 7.5 As a maximum magnitude ccd , this adjustment is exact , because the average difference between visual and ccd measurements is 1.5 magnitudes , therefore if we subtract 7.5-1.5 = 6.0 , for visual , as the maximum magnitude for early February .

Here i show the reduced light curve of the comet ZTF, all visual and ccd observations have been plotted, clearly at R=1.1 au, there is a decrease in the rate of increase in brightness of the comet, possibly due to a change in the predominant chemical volatile typical of new comets coming from the oort cloud, I have also calculated a maximum rate of water production of 1000 kgrs / second based on the formula of Sosa & Fdez (2011)

  log Q = 30.53-0.234*mred


Saturday, January 14, 2023

Update Light Curve C/2022 E3 ZTF

 Update the light visual and ccd curve of comet C/2022 E3 ZTF based in 2.509 observations from MPC DATABASE This is the largest light curve of this comet to date and is based on the sum of ccd and visual observations obtained from the MPC DATABASE ( 2.509 ), it is possible that the comet has suffered a slowdown in its rise in brightness and that at most it can reach a maximum visual magnitude of +6, the comets as in this case "new" coming from the oort cloud from heliocentric distances of r=1.4 au onwards due to processes and changes in the sublimation of gases from the nucleus they suffer a brightness blackout that is already being noticed in the visual light curve, perhaps a change in the predominant chemical volatile is the cause.


Sunday, December 19, 2021

UPDATE LEONARD COMET

 Comet Leonard quickly loses brightness, based on the latest visual observations of this comet, its latest report, is located at visual magnitude m1 = + 4.8, this means a rapid decrease in its rate of increase in brightness, and therefore in its gaseous and dusty activity, according to my calculation at a rate of 0.44 magnitudes per day, this is an excessive rate of decrease in brightness, after the burst of brightness, which took place a few days ago, specifically on December 14, Today the 19th, that is, 5 days later, the comet has lost 2.6 magnitudes, let's bear in mind that a jump of one magnitude is equivalent to a difference in brightness of 2.5 times (the fifth root of 100), so The comet in just 5 days, has varied approximately 6 times its difference in brightness, we can conclude that its period of visibility with the naked eye has been very short, according to my data, little more than a week ... however, it is still right now as bright as the comet 1 P / Halley in its appearance in 1986, I encourage all of you to keep trying to observe it, now that it is still relatively bright, remember, that it is already difficult to see comets of magnitude 5 as it is right now. Graphic : COBS .
https://fb.watch/9_SXErxymp/


Thursday, December 2, 2021

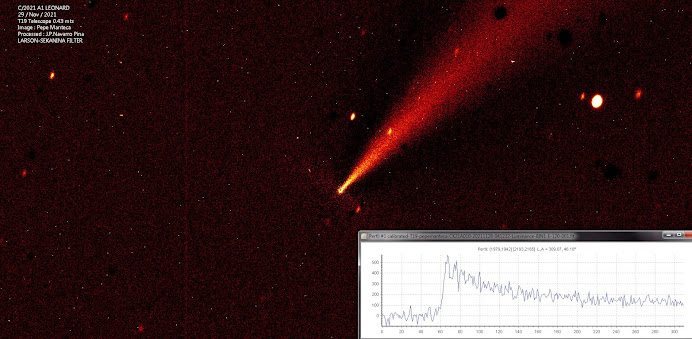
Images of comet C/2021 A1 LEONARD .


 Images of comet C/2021 A1 LEONARD .


LARSON SEKANINA FILTER LEONARD COMET

 Good morning before the doubts that this comet is offering, and the rumor that runs that it is disintegrating, I have used the larson sekanina filter, this filter calculates the radial and rotational gradient of an image. It is used to enhance the finest details in bright objects, exhibiting symmetry of revolution (elliptical galaxies and comet commas). This filter is very powerful to reveal internal details within the coma of bright comets (such as jets and shells), in the attached image not a single fragmentation detail is observed, only the ionic tail, in addition to that I have done to ensure even more, a GDP of the coma, in which there is no abrupt or strange change in it.

Image Credit: Pepe Manteca.

Processed: J.P. Navarro Pina.


Dall-Kirkham Telescope 0.43 mts.


Wednesday, December 1, 2021

Cometary blackout in Leonard's Comet

 I have a hypothesis that I have been studying for years for these

cases, when a comet suffers a fading of the rate of increase in
brightness, and that is that the comet suffers a change in the

predominant volatile component CO -> H2O, this is usually typical in
the new comets coming from the Oort cloud, this slowdown in its
activity index, usually occurs in the heliocentric range of 1.5 <R
1.2, as is the case of comet C / 2021 A1 LEONARD, I do not think it
will increase much plus its brightness, since my last analysis
indicates an index n = 2.24, the term 2.5 n log R, represents the
change in brightness due to the variation of the heliocentric distance
of the comet, and the brightness varies by pure reflection n = 2, as a
solid object without gaseous activity, which I call the '' cometary
blackout '' .

Graphic adapted by COBS , Analysis J.P.Navarro .


Monday, November 29, 2021

NO FRAGMENTATION COMET 2021 A1 LEONARD

 I have just carried out an analysis of the brightness intensity profile of the coma of comet C / 2021 A1 LEONARD, and no apparent rupture or fragmentation is observed at the coma level, we await more observations that can confirm this fact .
Image Credit : Pepe Manteca
Processed : J.P.Navarro Pina


Sunday, November 28, 2021

Comet C / 2021 A1 LEONARD could be visible to the naked eye by Christmas 2021.

 After a last update of the light curve of Comet Leonard, and using only visual observations, it seems that, if there are no surprises, the comet could be visible to the naked eye, my last estimate indicates a probable maximum visual magnitude of m1 = + 4.6 for the date of December 11, 2021, until reaching its perihelion in January 2022, its rate of increase in brightness is quite low, Law Power R ^ -1.7, and n = 4.46, but it is usual for new comets coming from The Oort Cloud, I attach the light curve, but beware, this curve mixes ccd and visual, it is important to differentiate both types of observations, since the difference is usually 1.5 magnitudes, according to a personal study, in this regard, Using the heliocentric and geocentric distances, based on the classic brightness formula for comets, using logarithms for the comet-earth and comet-sun geometry, it could give us a visual magnitude close to +5 and perhaps +4, everything will depend of the act ivity that the comet demonstrates in the determining moments of its proximity to the sun:


m1 = + 8.2 +5 log (D) +4.46 log (R)


This formula is far from the one calculated based on the CCD + VISUAL data, which based on 842 observations would look like this:


m1 = + 11.7 +5 log (D) +5.59 log (R)


The contribution of dust + gas is added in the case of this last formula, we take into account that the spectral response ccd for comets is similar to the amount of dust dispersed and emitted by sunlight, and unlike visual observations, where we observe the swan and C2 bands, and the sum of OH, indicating a small portion of the gas emitted, this leads us to the conclusion that there is more gaseous emission in Comet Leonard than dust.


Monday, September 6, 2021

Update Analysis Light Curve C/2021 A1 LEONARD A1

 My second analysis of the light curve of comet C / 2021 A1 LEONARD, indicates in T-300, a stagnation in the rate of increase in brightness or activity index with a brightness law similar to that of a solid object without gaseous activity. of R ^ (- 1.4), following this same brightness law, its maximum visual magnitude at perihelion could reach m1 = +9.5, in the best of cases.

Also a more exhaustive analysis of the light curve could indicate a probable precession period of the cometary nucleus, with a periodicity of approximately 40 days, due to a sudden increase in brightness or outburst in its light curve around +0.5 at +0.7 magnitudes (+0.7 <dm1 <+0.5) -> P (prec) ~ 40 days.

The estimated general gloss formula is:


m1 = +12.9 +5 log (D) +3.6 log (R)


Based on 525 MPC brightness measurements, and a data residual of +0.52.

Image Credit : J.P.Navarro Light Curve C/2021 A1 LEONARD ( Update 05/09/2021 )


Physical and Physicochemical Analysis of Comet 3I/ATLAS (C/2025 N1)

  Physical and Physicochemical Analysis of Comet 3I/ATLAS (C/2025 N1) J.P.Navarro Pina Observatorio Astronomico Vega del Thader MPC J70/IA...